Issue 58: Georgia’s Trade with EU Member Countries – I-III Quarters, 2015

|
Georgia’s Trade with EU Member Countries – I-III Quarters, 2015
Issue #58 / 23.10.2015
|
||
|
During the first three quarters of 2015, the share of trade turnover between Georgia and EU member countries in Georgia’s total trade turnover is 31.7% , which exceeds (5.6% point) the same indicator in 2014. In this period, the share of export to EU member countries in total export is 28.6% and the share of import from EU member countries in Georgia’s total import is 32.6%. In this period, the export from Georgia to EU countries as well as the import from EU member countries to Georgia increased by 2.1% and 6.8%, respectively.
|
||
|
|
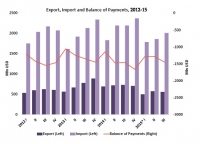
During the first three quarters of 2015, the volume of registered trade turnover in Georgia is US$7,309 mln. The share of import in Georgia’s total trade turnover is 77.5% and the share of export in it is 22.5%.
In this period, compared to the corresponding period in 2014, the volume of export as well as the volume of import declined by 23.6% and 9.1%, respectively. These indicators were declining during all quarters, but the highest (-27.7%) decline of export is recorded in the first quarter and the highest decline of import (-15.2%) is recorded in the second quarter of 2015. Due to the fact, that volume of import (US$-564.3 mln) is declined more compared to the volume of exports ( US$-508.0 mln), the negative trade balance also declined by 1.3%.
|
|
|
|
||
|
|
|
|
|
Source: GeoStat
Although, the total export of Georgia was declining during the first three quarters of 2015, compared to the corresponding period in 2014, the export to EU member countries increased by 2.1% and amounted US$471 mln. During the first three quarters, the largest growth of export (38.9%) to EU member countries is recorded in April (38.9%), while the largest decline – in May (-39.5%). During I-III quarters of 2015, the import from EU member countries to Georgia increased by 6.8% and amounted US$1847 mln. In this period, significant amount of medicaments for Hepatitis C were imported from EU member countries. Georgia did not pay for importing this product (it was given as a present to the country), hence, it is entered in the balance of payment as an import on the one hand and as a government transfer (grant) on the other hand. Therefore, it did not cause currency outflow from the country and did not affect on current account balance. The growth of import from EU countries are recorded in May (46.6%), August (12.6%) and September (42.1%), while during the other months of the first three quarters this indicator declined compared to the corresponding indicator of 2014. During this period, the highest decline (-21.0%) of import is recorded in April.
|
||
|
|
|
|
| Source: GeoStat
During I-III Quarters of 2015, 35.2% of Georgia’s total export to EU member countries was to Bulgaria, 11.4% – to Italy, 9.9% – to Germany, 7.6% – to Netherlands, 6.1% – to Spain and 29.6% – to the other EU member countries. Among them, compared to the corresponding period in 2014, the export increased to Netherlands (68.5%) and Bulgaria (29.6%), while declined to Spain (-49.4%), Italy (-10.3%) and Germany (-6.0%). This structure differs from the structure in the corresponding period of previous year. In 2014, among the top five EU member partner countries in export was Belgium (7.3 %), while the Netherlands was not among them. The main commodities exported to Bulgaria are copper ores, petroleum and fertilizers, to Italy – nuts and fertilizers, to Germany – nuts, fruits and juices of fruits and vegetables, to Netherlands – nuts, alcoholic beverages and wine and to Spain – copper ores and ferro-alloys. In this period, 17.5% of imported production from EU member countries are from Ireland, 17.0% – from Germany, 9.0% – from Romania, 7.7% – from Italy, 8.8% – from Bulgaria and 41.4% from the other EU member countries. Among them, the import significantly increased from Ireland (42.3 times), while declined from Romania (-29.6%), Bulgaria (-20.9%), Italy (-12.8%) and Germany (-9.0%). This structure of the top five EU member partner countries in import differs from the structure in the corresponding period of 2014. In 2014 among the top five importers were Netherlands (6.1%), while the Ireland was not among them. The main commodities imported from Germany are motor cars, medicaments and medical equipment, from Ireland – medicaments, mixtures for beverages, motor cars and automatic data processing machines, from Romania – petroleum and medicaments, from Italy – mechanical equipment and furniture, from Bulgaria – petroleum, medicaments and cigars.
|
||
|
|
|
|
|
Source: comtrade.un.org
In January-May 2015, the top five exported commodities from Georgia to EU were: nuts (24.9%), copper ores and concentrates(24.0%), petroleum (6.8%), mineral and chemical fertilizers (5.4%) and ferro-aloys (4.9%). Among them, compared to the corresponding period in 2014, the volume of exports the following products increased significantly: nuts (4.5 times) and petroleum (88.5%), while the export of the following products declined: copper ores and concentrates (-42.5%), mineral and chemical fertilizers (-42.7%) and ferro-aloys (-30.1%). The nuts are exported mainly to Germany, Italy and the Czech Republic, copper ores and concentrates – to Spain and Bulgaria, Petroleum – to Italy, fertilizers -to Bulgaria, France and Greece, the ferro-aloys – to Greece, Portugal and Spain. In this period, the top five imported commodities from EU member countries are: medicaments (21.8%), petroleum (13.7%), motor cars (4.9%), trucks (1.8%) and telephone sets (1.8%). Among them, compared to the corresponding period in the previous year, the imports of medicaments (3 times), petroleum (47.8%) and telephone sets (2-times) increased, while the imports of motor cars (-25.3%) and trucks (-3.5%) declined. The medicaments are imported mainly from Germany, Hungary and Italy, the petroleum – from Italy and Netherlands, motor cars and trucks – from Germany, Netherlands and Italy, the telephone sets – from Netherlands, Germany and Hungary.
|
||
|
|
||
 |
||
 Source: GeoStat


