Issue 51: Consumer Prices – January – June, 2015

|
Consumer Prices – January – June, 2015
Isuue #51 / 31.07.2015
|
||
|
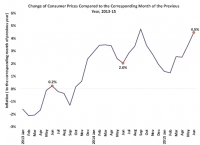
In June 2015, compared to June 2014, consumer prices increased by 4.5%.
In this period, the highest growth of prices recorded on the following categories:
• Alcoholic beverages and tobacco (11.4%). Among them increased the prices of vodka (28.5%), domestically produced non- filter cigarette (23.6%) and beer (14.6%).
In this period, the largest reduction of prices recorded on the following categories:
• Clothing and footwear (-3.3%). Among them prices declined on child’s jacket (-12.8%), man’s suit (-10.0%), child’s shirt (-5.2%) and girl’s summer shoes (-4.6%).
In June 2015, the prices of commodities of the subsistence minimum basket increased on avarage by 18.2%, while the subsistence minimum for working age male increased on avarage by 7.9 %.
|
||
|
Source: GeoStat
|
Source: GeoStat
|
|
|
In 2015, an updated consumer basket consists of 295 varieties of consumer goods and services. The largest share in the basket has food and non-alcoholic beverages (31%), transport (12%), health care (9%), housing, water, electricity and natural gases (9%) and recreation and culture (7%).
In the period of January-June 2015, compared to the corresponding period in 2014, the prices increased by 2.6% on average. The largest share in this growth has food and non-alcoholic beverages (1 percentage point). It should be noted that in the period of January – June 2014, compared to the corresponding period in 2013, the share of transport in the growth of prices was positive (0.1%), but in the corresponding period in 2015 this indicator is negative (-0.6% point).
|
||
|
Source: GeoStat
|
Source: GeoStat
|
|
|
In the period of January-June 2015, compared to the corresponding period in 2014, the prices of food and non-alcoholic beverages increased by 3.3% on average. In this category the highest growth of prices was recorded in the following products: peach (64.0%), tangerine (62.8%) and walnut (56.2%). In this period, the highest increase of the prices of food and non-alcoholic beverages was recorded in Batumi (4.5%), while the lowest – in Gori (2.3%).
In the period of January-June 2015, compared to the corresponding period in 2014, the prices in the transport group declined by 4.9%, which is due to the reduction of the prices on the following products: diesel fuel (-14.4%), gasoline (-14.0%) and intercity motor transport tariff (-5.5%). In this period, the highest reduction of prices in transport group was recorded in Tbilisi (-5.5%), while the lowest– in Kutaisi (-3.5%).
|
||
|
Source: GeoStat
|
Source: GeoStat
|
|
|
In the period of January-June 2015, compared to the corresponding period in 2014, the prices in health care group increased (6.7%). Among them, the highest growth of prices was recorded on anti-inflammatory drugs (20.0%), on antibiotics (15.1%) and on vitamins (14.4%).
In this period, the highest increase of prices was recorded in Batumi (10.9%), while the lowest – in Tbilisi (4.7%).
In the period of January-June 2015, compared to the corresponding period in 2014, the prices on housing, water, electricity and gas increased (1.4%). The highest growth of prices was recorded on the following products: window glass (22.5%), emulsion paint (12.1%) and plumber’s service (11.4%).
In this period, the prices of this category increased in Tbilisi (3.1%), Gori (2.1%), Batumi (1.9%) and Telavi (0.6%), while declined in Kutaisi (-3.5%).
|
||
|
Source: GeoStat
|
In the period of January-June 2015,compared to the corresponding period in 2014, the prices on recreation and culture increased (2.6%). The highest increase of prices was recorded on the following products: newspaper (9.8%), school books (9.0%) and cable TV fee (7.6%).
In this period, the highest increase of prices in this category was recorded in Batumi (4.1%) . The prices increased equally in Telavi, Tbilisi and Kutaisi (2.5%), while the prices declined in Gori (-0.1%).
|
|
|
|
||
 |
||


